City of Duluth General Sales and Use Tax
November 2025
Budget and Revenue Totals
| Budget Type | 2023 | 2024 | 2025 |
|---|---|---|---|
| Adopted Budget | $15,000,000.00 | $15,784,000.00 | $17,617,300.00 |
| Amended Budget | $15,000,000.00 | $15,784,000.00 | $17,617,300.00 |
| YTD Revenue | $19,016,504.44 | $19,007,615.22 | $17,335,847.52 |
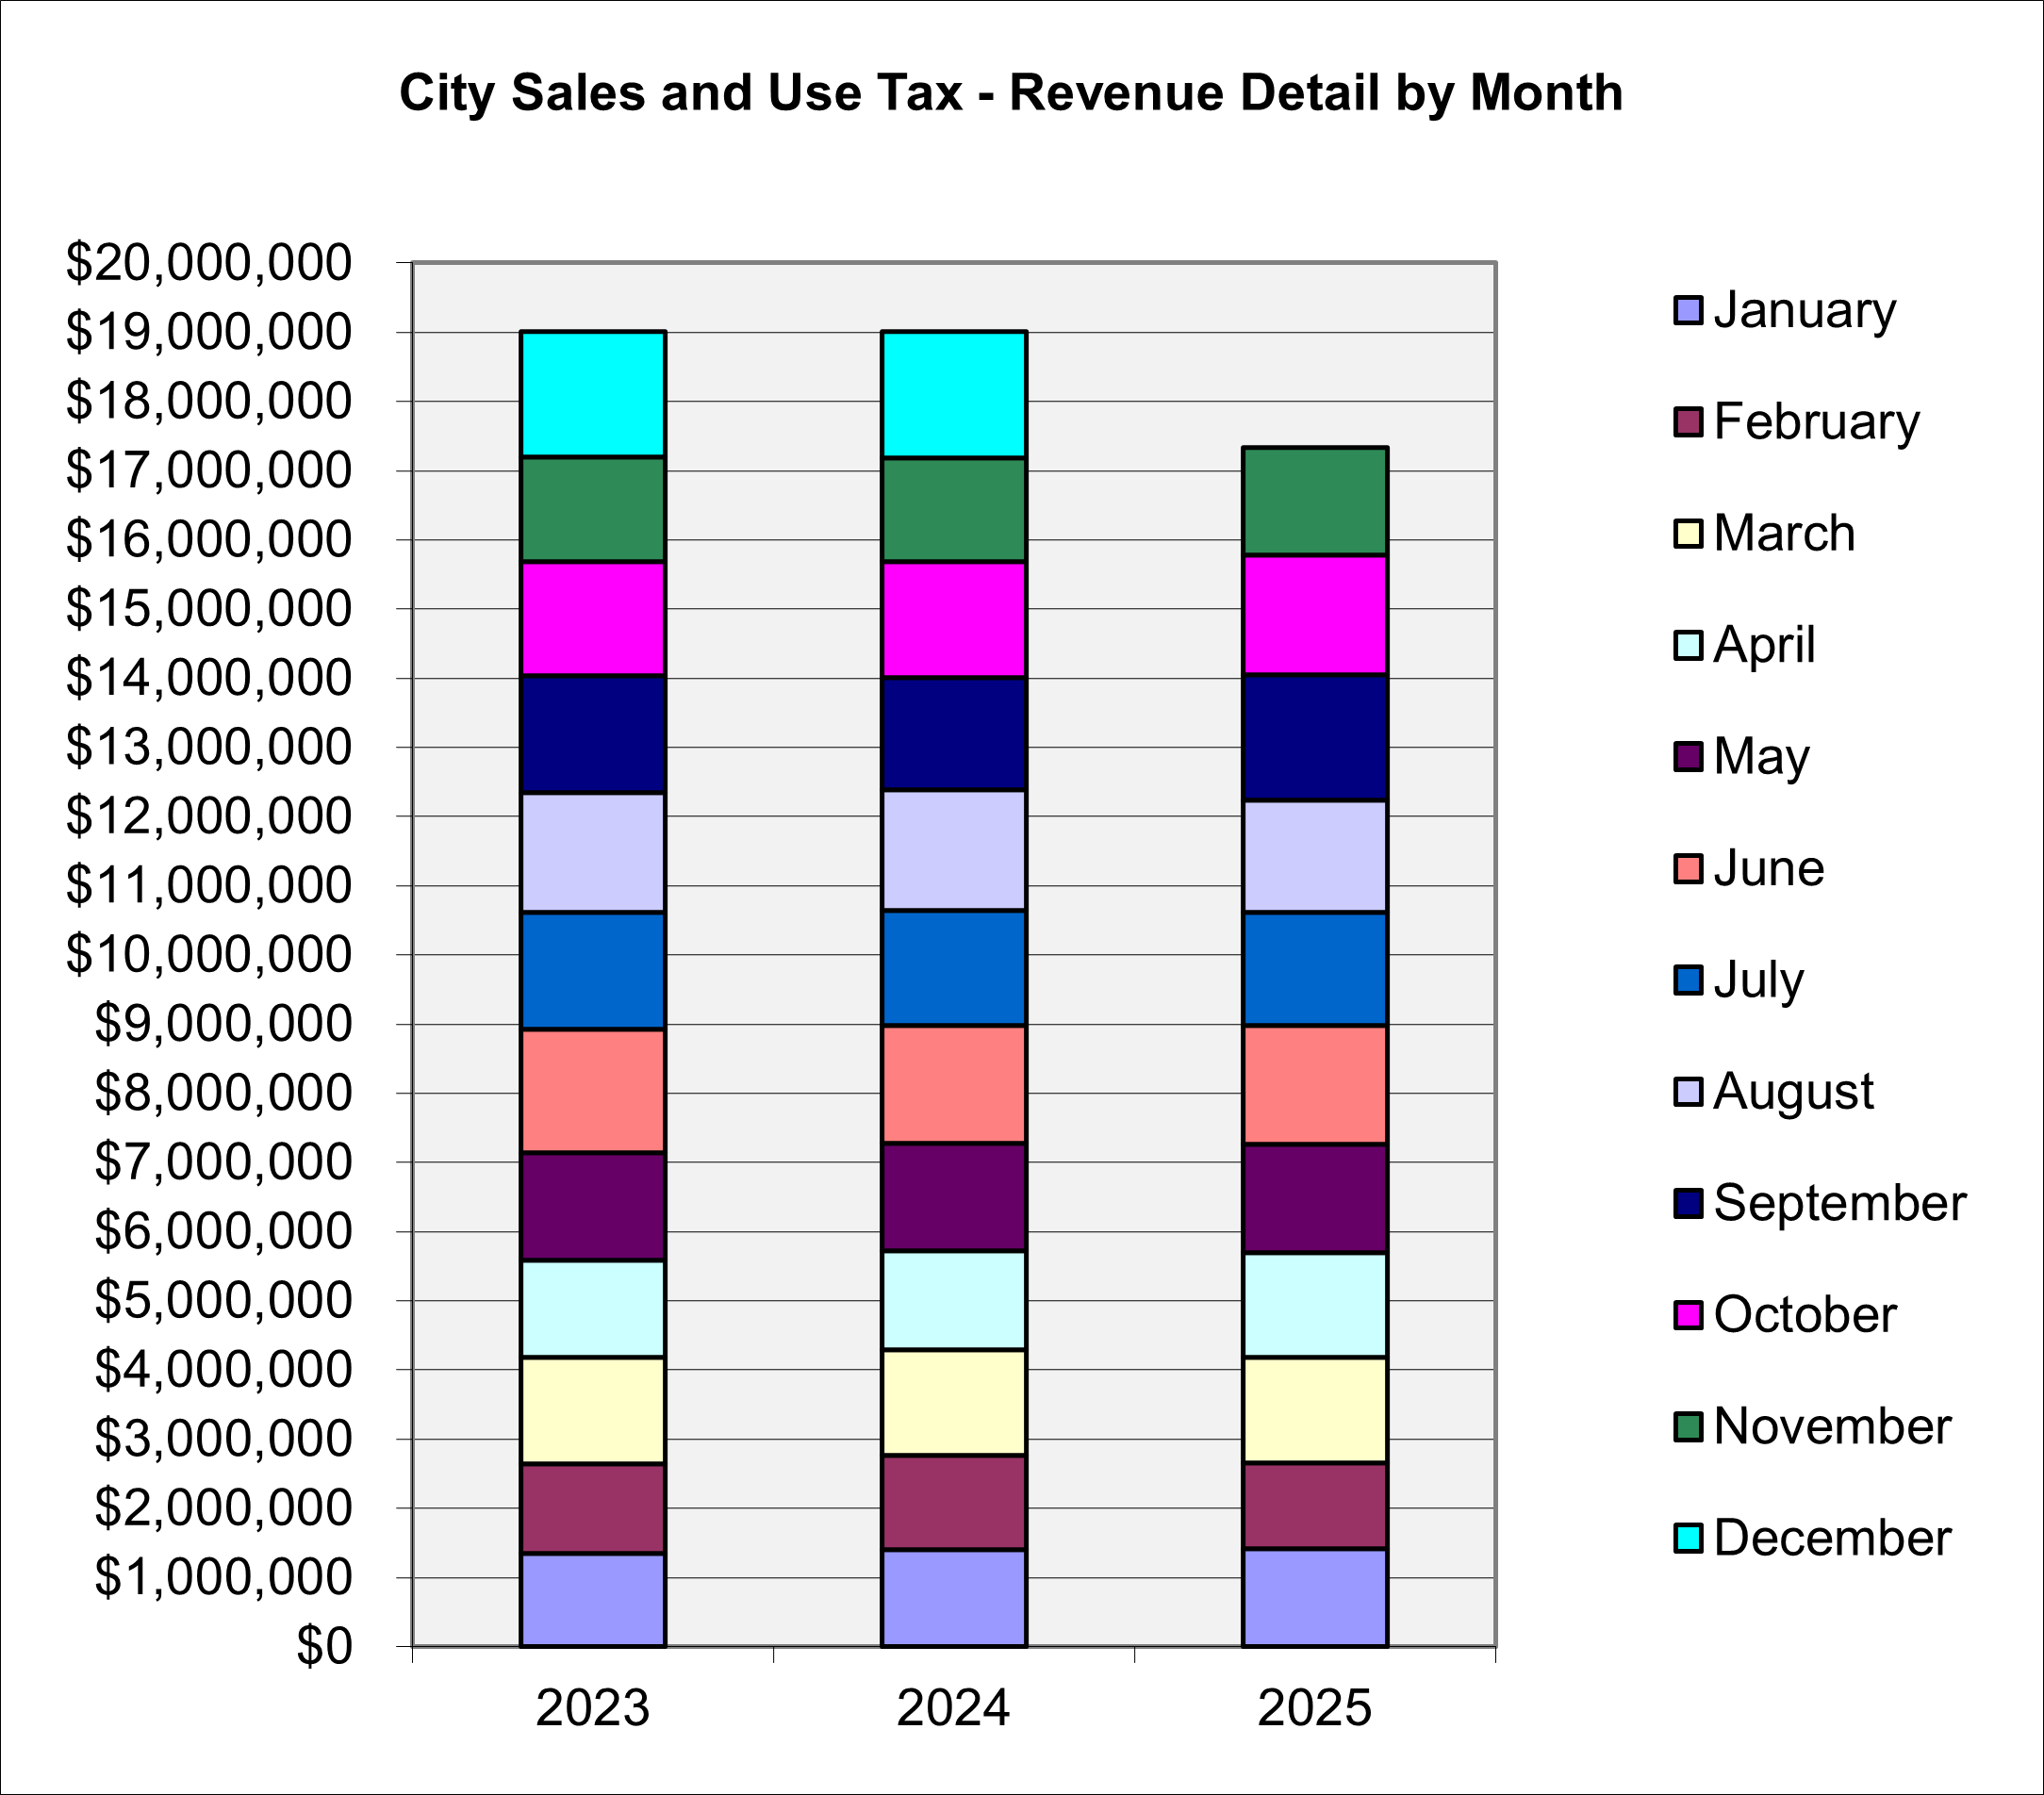
Revenue by Month
| Month | 2023 | 2024 | 2025 | MO % Change | YTD % Change |
|---|---|---|---|---|---|
| January | $1,350,981.27 | $1,403,982.60 | $1,411,060.83 | 0.50% | 0.50% |
| February | $1,296,779.19 | $1,362,148.30 | $1,246,328.58 | -8.50% | -3.93% |
| March | $1,530,632.16 | $1,521,733.49 | $1,530,727.33 | 0.59% | -2.33% |
| April | $1,402,985.14 | $1,438,801.76 | $1,503,401.65 | 4.49% | -0.61% |
| May | $1,560,210.71 | $1,552,197.66 | $1,566,924.96 | 0.95% | -0.28% |
| June | $1,785,619.62 | $1,702,208.39 | $1,720,318.75 | 1.06% | -0.03% |
| July | $1,691,308.02 | $1,665,034.24 | $1,630,400.78 | -2.08% | -0.35% |
| August | $1,734,476.01 | $1,744,813.78 | $1,624,119.24 | -6.92% | -1.27% |
| September | $1,687,568.84 | $1,613,408.11 | $1,821,260.35 | 12.88% | 0.36% |
| October | $1,647,715.60 | $1,680,114.60 | $1,722,170.01 | 2.50% | 0.59% |
| November | $1,509,742.57 | $1,499,104.63 | $1,559,135.04 | 4.00% | 0.89% |
| December | $1,818,485.31 | $1,824,067.66 | — | — | — |
| Total | $19,016,504.44 | $19,007,615.22 | $17,335,847.52 | — | — |
*Fee note: Beginning in 2024, the State began charging a flat 1.35% fee on sales tax collections. The fee is reflected in the sales tax figures for 2024 through March. Beginning in April 2024, the State reduced the fee to 0.00%. Beginning with payments made in January 2025, the State charges a flat 0.90% rate.
The general sales tax amounts above correspond to the monthly activity reported by the MN Department of Revenue, which collects the tax and remits advance and settlement payments to the City. The final payment is received in March of the following year, which represents a significant lag time from the sales period.
Current period collections in 2025 are up $60,030.41 or 4.00% compared to last year.
Year-to-date collections in 2025 are up $152,299.96 or 0.89% compared to last year.
Note: The timing of return filing/processing with the State of MN can impact month-to-month analysis.
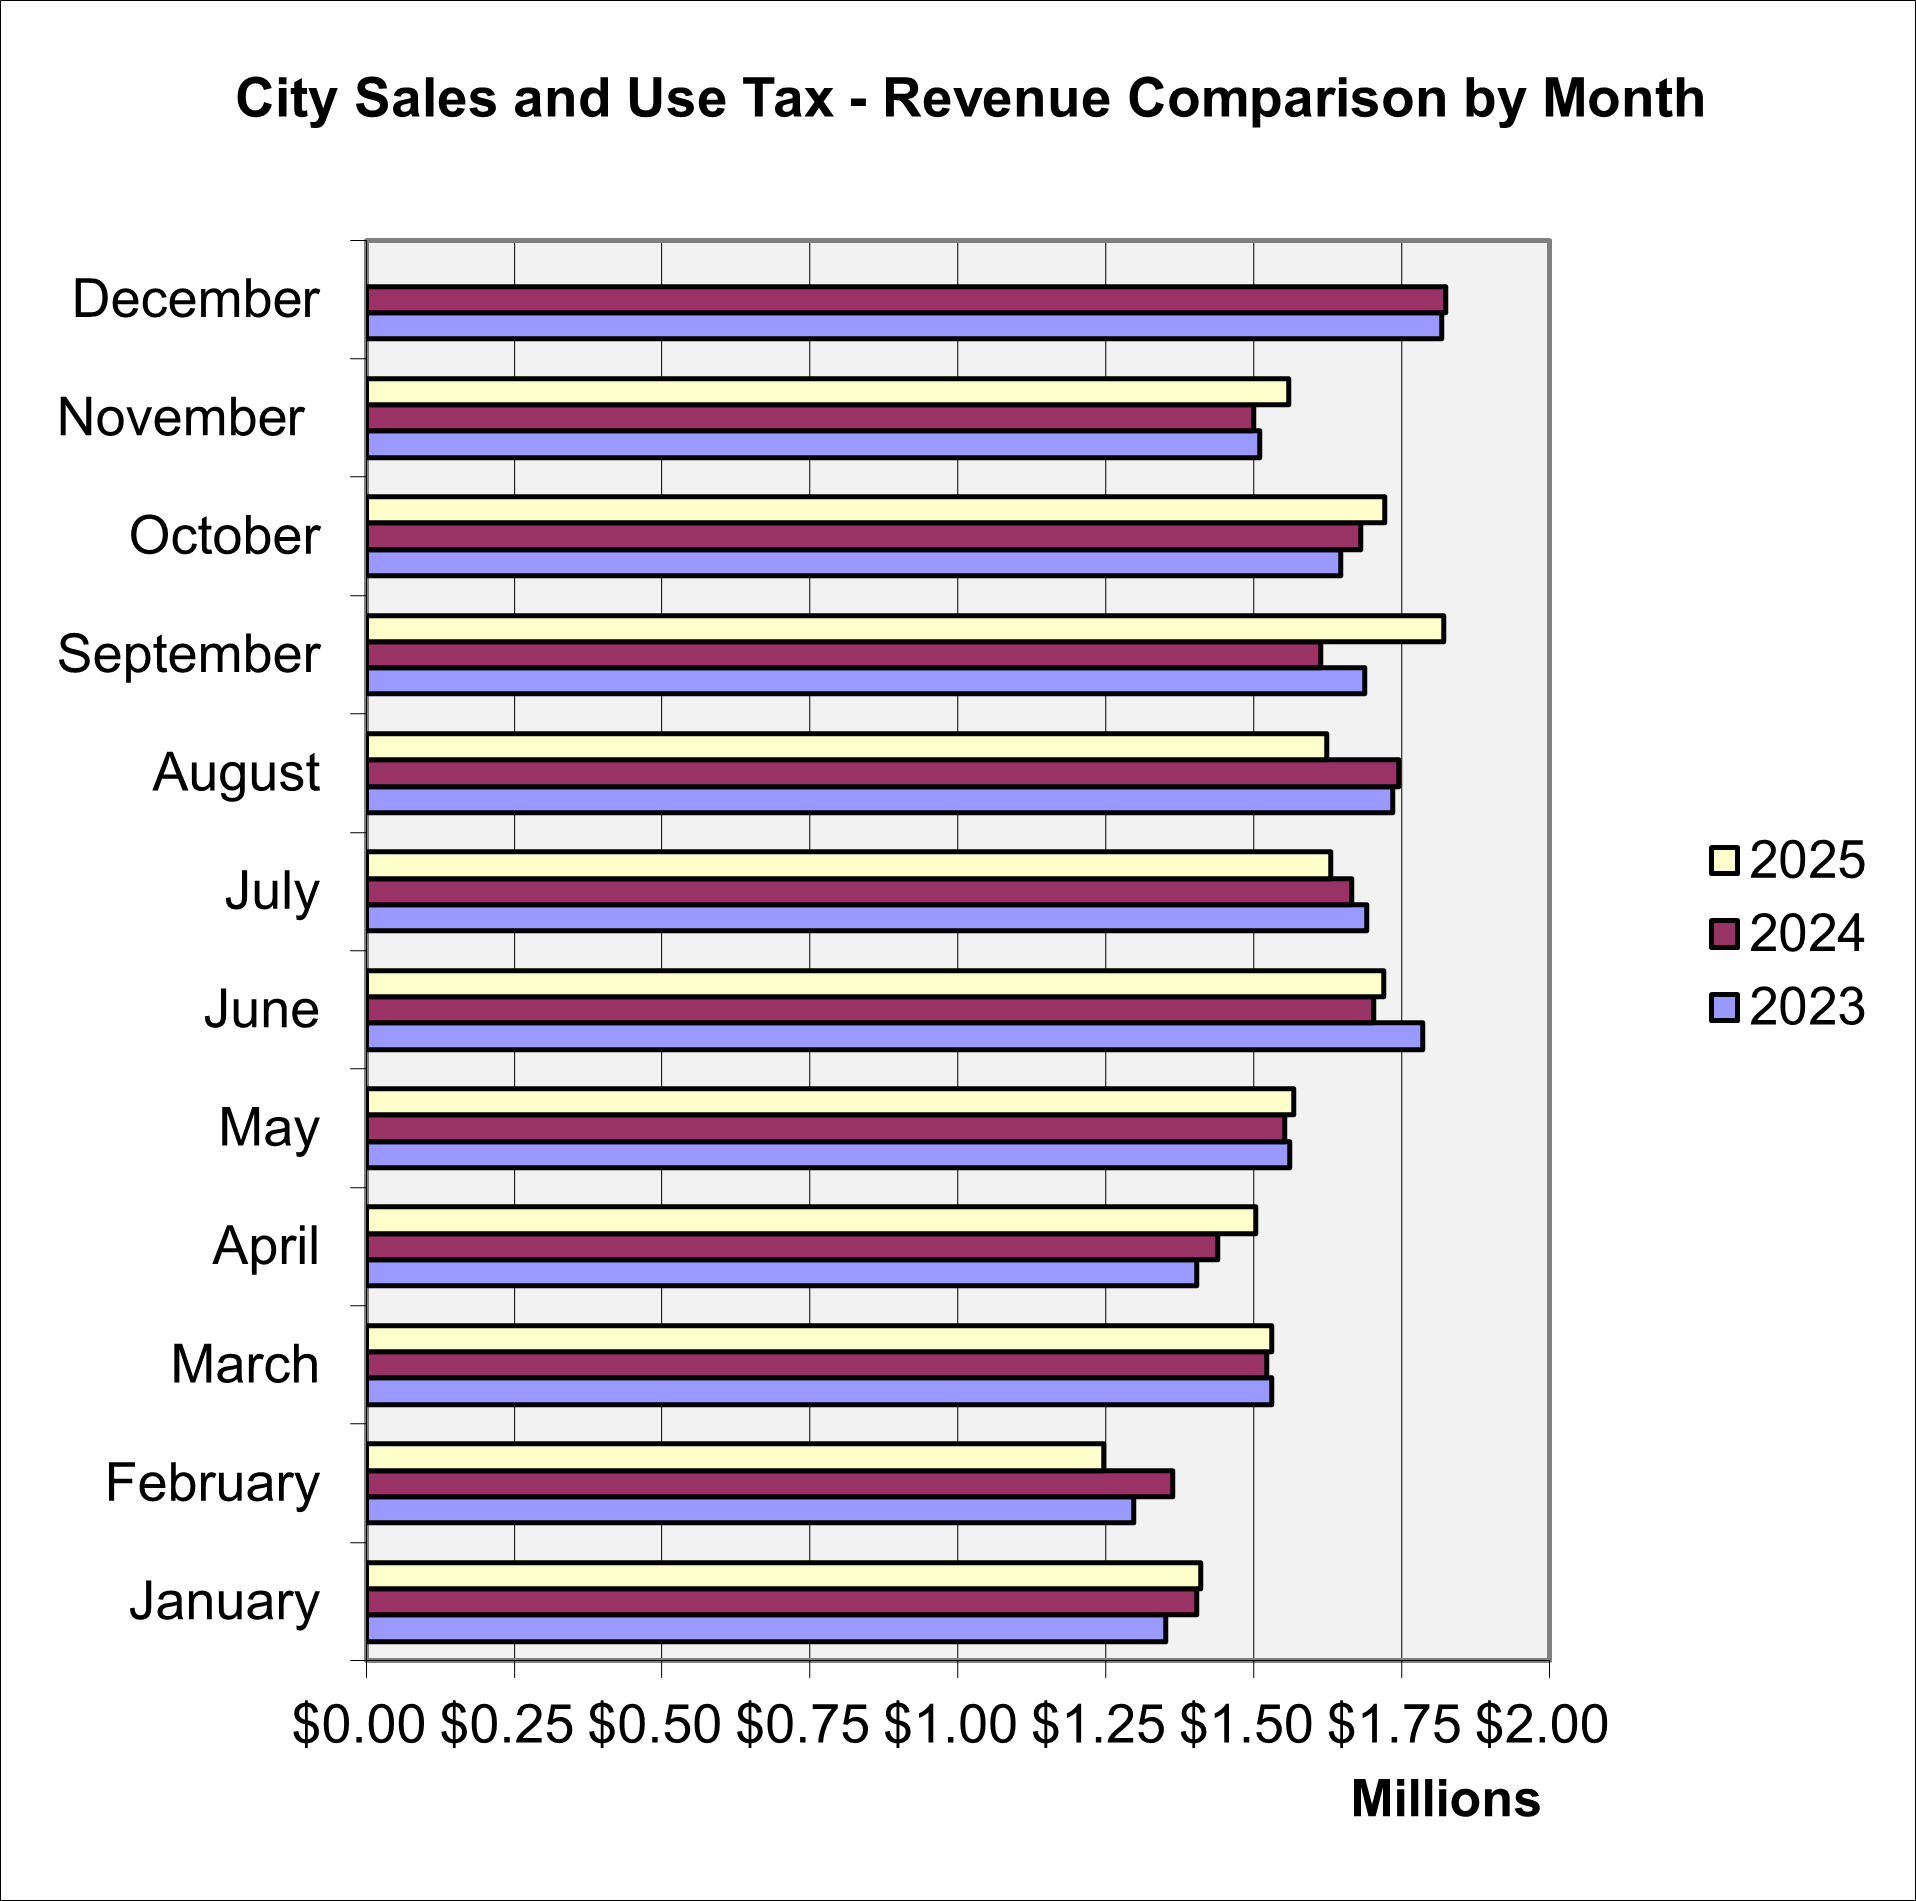
The first chart compares revenues to the adopted and amended budgets, while the second chart shows a stacked approach to monthly and year-to-date revenue, while the third chart shows individual monthly collection comparisons.